

For years, pollination conversations split into two half-stories. On one side: are the colonies strong enough, active enough, and placed where the contract promised? On the other: are bees actually moving through the rows when flowers are open?
BeeHero already answers each half with different hardware and pipelines. In-Hive — Precision Pollination as a Service (PPaaS) — watches the hive side: frames, activity, markers, and weather enrichment that feeds the grower dashboard hour by hour. In-Field — Pollination Insight Platform (PIP) — brings the orchard floor into focus with sensing points that are not tied to a hive: bees per minute, local temperature and humidity, and the spatial pattern of traffic across the bloom.
Neither story is wrong. Alone, each leaves a blind spot. Strong hives in the wrong weather window look fine on paper. Busy sensing points next to thin colonies raise different questions. Comprehensive coverage means seeing both without flipping between product worlds.
In-hive sensors are the backbone growers already recognize from the pollination dashboard. Hourly orchard metrics combine bee frames, bee activity scores, flight-time signals, and weather so an orchard has a living pulse during bloom—not a post-season autopsy.
At the marker level you get hive counts, frame strength, and activity tiers that turn messy flight hours into something a team can scan: good, medium, or low activity windows. Daily rollups then summarize frames per acre, monitored hives, and the day’s flight story once the local day closes.
That hive-and-activity layer answers the supply question: what pollination capacity did we put on this ground, and how hard were the bees working?
In-field sensing points sit in the orchard itself. They are seasonal, fixed locations—gateways and sensors in the rows—watching bee traffic where the flowers are, not only where the boxes sit.
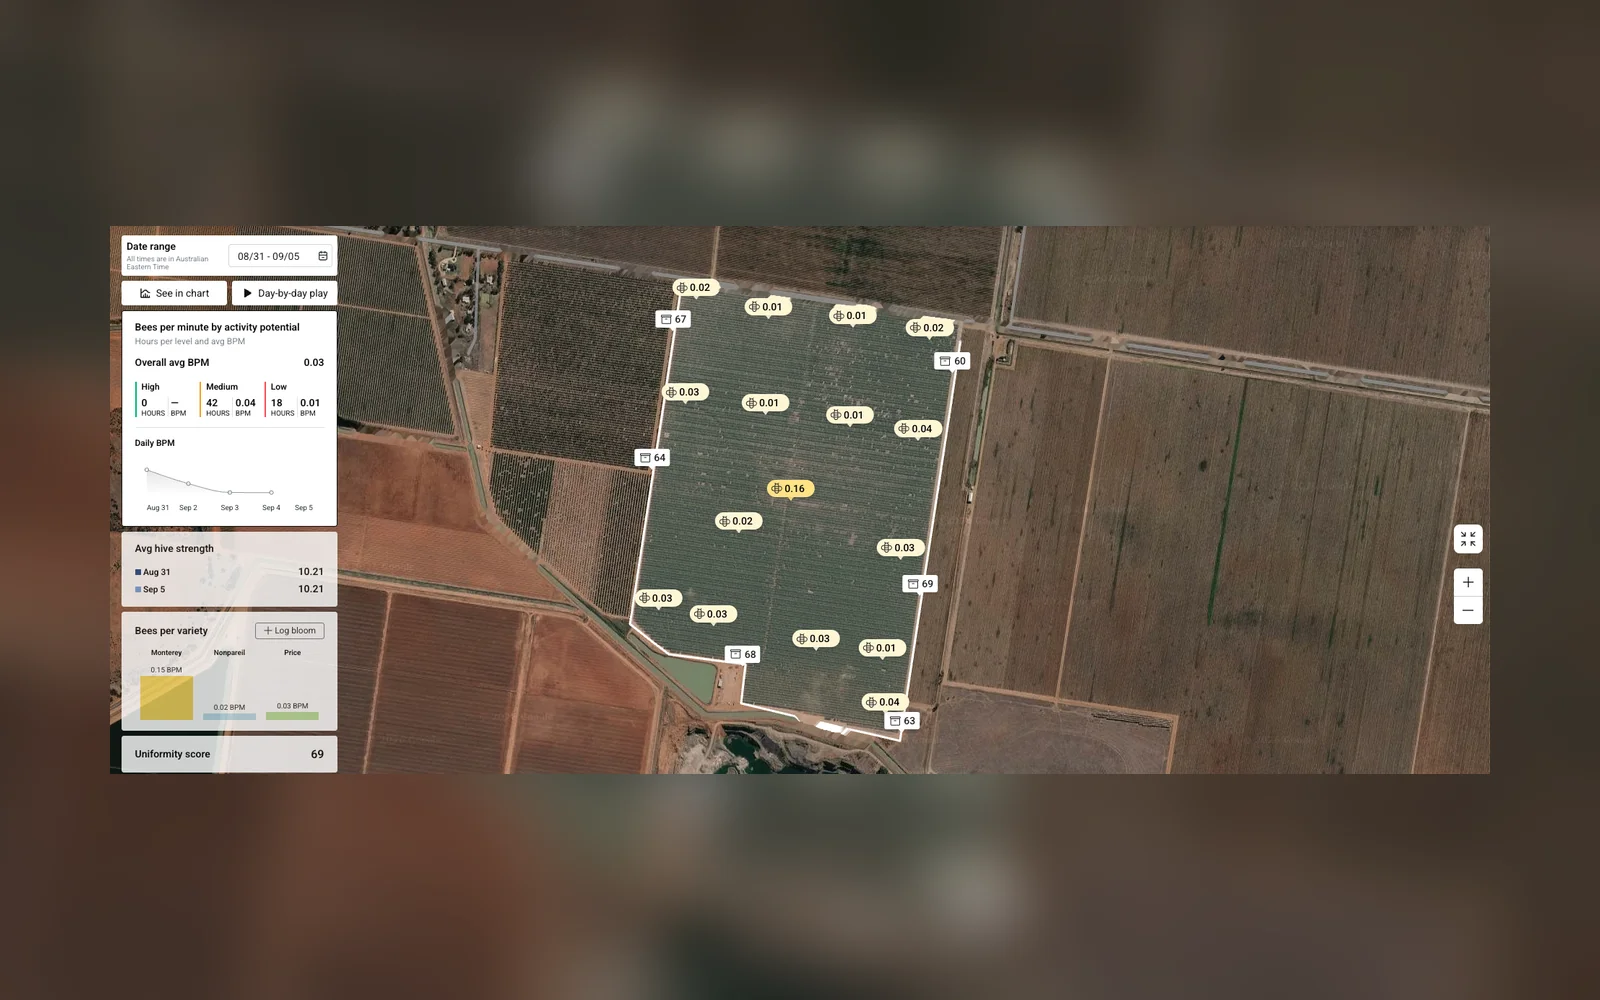
The signal growers care about day to day is bees per minute (BPM) at those points, plus the microclimate around them. Uniformity and variety breakdowns come from that point cloud: is traffic concentrated on one corner, or spread across the block? Are labeled varieties seeing similar pressure?
Because in-field updates and in-hive marker updates are independent streams, a gap on one side is not automatically a failure on the other. A quiet sensing hour with healthy hive markers is a clue, not a contradiction—and that independence is exactly why combining them matters.
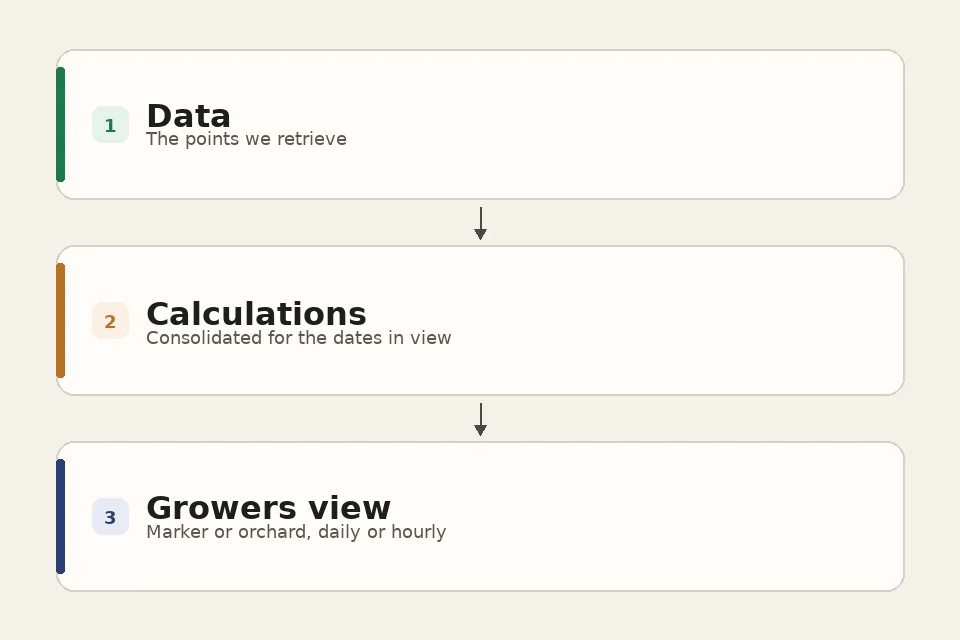
In the Growers app, orchards that carry both in-field and in-hive sensors become smart orchards. The dashboard asks for both hourly streams over the same dates, lines them up in farm-local time, and merges them on shared markers: an in-field point id and an in-hive orchard marker id refer to the same place on the map.
React Query hooks do that fetching. A single hook gathers what the view needs: the in-hive orchard record, the in-field orchard, hourly sensor updates, hourly marker updates, orchard-level hourly rollups, bloom logs, and the day’s weather. React Query holds each response, so a chart and a map looking at the same orchard and dates do not start those downloads over.
When the sources are in, the app builds one shared hour context and runs a calculator layer across it. Marker calculators go first, then orchard calculators: activity hour counts, bees-per-minute series, frame distributions, bloom by variety, uniformity, and the rest. A lot of those numbers share earlier math. The run keeps a small cache. The first calculator that needs daily bees per minute, total frames, or activity by hour computes it. The next calculator reads the cache instead of doing that work again. A thin stretch on one stream does not stop the others. Each calculator uses what it has, and missing hours stay missing.
The finished set is written back into React Query under a key for that orchard and date range. The screens do not rerun the math. A map pin, a chart, or an overview card calls a small UI hook — useOrchardMetric for an orchard-wide metric, or useMarkerMetric for one place on the map — and reads that single metric from the cached result.
Every grower still asks one question during bloom: how is my pollination going? In-hive data answers with strength, placement, and activity. In-field data answers with bees on the flowers and conditions in the canopy. Together, growers can connect weather, bloom stage, hive strength and location, and flower activity - not only what is happening, but why, and where they can still act.
That same pairing tells them when not to act. Low flower activity and low hive activity on a cold, windy, or rainy day usually means wait for better flying weather. Lower bees per minute on a block while in-hive strength and activity look healthy, with good weather, is a cue to check bloom stage, placement, or distribution in that corner.
Looking ahead, the combined view is meant to deepen work with growers who already run both streams: actionable recommendations during bloom, and an end-of-season story that turns into next year’s plan—which blocks performed, what made the difference, and what to adjust on placement or density.
On the ops desk, the morning still starts on the supply side. Open the Smart Orchard view, check hive counts and frame strength by drop, and ask whether each beekeeper delivered the contracted strength. Weak loads are the usual reason an inspector goes out or a beekeeper gets a call—one recent pattern was a load averaging six frames against a contract of eight. Once supply checks out, activity tiers and the weather window come next, because strong hives that cannot fly on a cold morning are still a lost day for the grower.
In-field sensing trials in several Australian orchards answered a question ops used to walk rows for: are bees actually in this block, in this window. Thin bees per minute with healthy hive markers usually points to weather first. When weather does not explain it, someone walks the drop: sample frame counts against the sensors, placement against the block map, and a few minutes of entrance flight. Most walks end in a move - strong hives in the wrong spot - or a beekeeper call when the boxes are weaker than the markers suggested.
When a weak load is confirmed, the fix scales with the gap. A small shortfall is often settled on audited frames at the final count. A larger gap is a same-week top-up, swap, or network source, because bloom is only three to four weeks and an early fix still protects most of the set.
Comprehensive pollination coverage is not a single KPI. It is the ability to move from “how many frames per acre?” to “where did bees show up today?” without leaving the grower experience - and to turn that into a field move, a wait call, or a clearer season review.
On the map, hive markers and sensing points share geography. In charts, in-hive activity tiers sit beside in-field bees per minute so a cool morning shows both supply and traffic. Day-by-day and overview modes keep the same metric language so a desk review and a drop walk are looking at one system.
BeeHero’s job in the field is to make pollination coverage visible. The Growers Smart Orchard view measures that coverage as capacity at the hive, traffic in the rows, and the story they tell together.