
What do we Monitor?
The BeeHero In-Hive Sensor monitors several key parameters: hive activity, temperature, humidity, and acoustics. In this discussion, we will concentrate on the three main biological factors we examine using the sensor data: brood temperature, brood humidity, and colony sound. We will explain why we use these measurements and how they can provide insight into the condition of the colony.
Colony audio
As you know, bees use sounds and vibrations to communicate within the hive, and they also generate specific sounds in response to events at the hive. Behaviors such as fanning and hissing also have their own distinctive sounds. Monitoring the sounds in the hive is like listening to the heartbeat of the colony, and reveals valuable insights about changing behavior and status.

Brood Temperature
The temperature in the brood nest is precisely controlled by a colony to within the range 93-97ºF (33ºC - 36ºC). By tracking the current and historical brood temperature we can detect when it deviates from these optimal conditions. The ability of a colony to maintain stable brood temperature is the result of coordinated behavior of the bees and is therefore a good indicator of colony function and health.
Brood Humidity
Humidity is also regulated by the bees, although to a lesser extent than temperature, usually within the range 50-75%(Relative Humidity). Low humidity can damage brood development, and high humidity increases chances of mold growth and condensation in the hive.
While these measures are useful individually, the most powerful insights are generated when they are combined. They are often interrelated, for instance, fanning bees produce a distinct noise, and this behavior is also used to manage temperature and humidity within the hive. A declining colony will exhibit a fall in overall noise level, as well as a loss in stability of brood temperature.
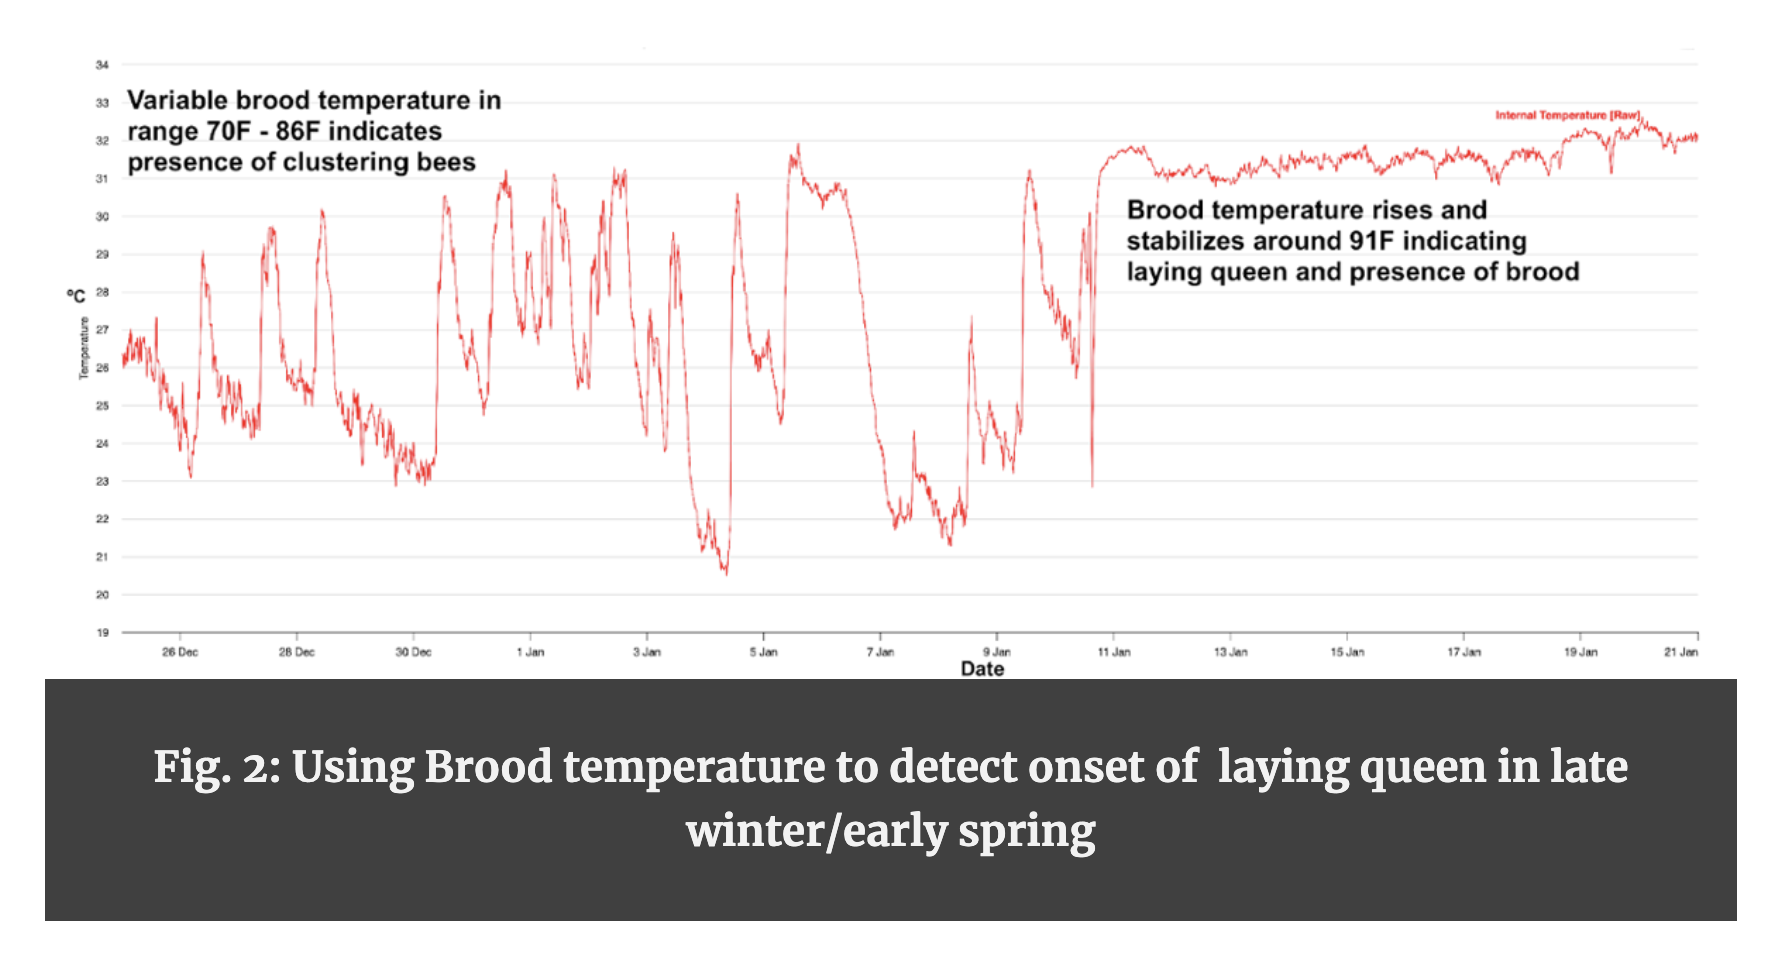
All these data need to be analyzed in the context of the time of year and prevailing weather conditions. For example, in temperate climates, the bees cluster over winter, and the queen stops laying. Thus in the Fall, we would expect to see a decline in brood temperature and changes in colony audio as the bees start clustering. Similarly, in late winter/early spring, we would expect to see a rising and stabilizing brood temperature, indicating the queen has started laying again (See Figure 2). The sensors enable us to detect these seasonal cycles in activity as well as the impact of daily changes in weather conditions. And on the subject of data, the BeeHero algorithms are trained on millions of instances, in fact, we recently crossed an important milestone. Our sensors now capture over 10 million hive samples from over 100 thousand hives globally every day. This means that our models and predictions are increasingly more precise.
Hopefully, this article has provided a useful overview of the data collected by the In Hive Sensors and what it can tell us about colony health and status. In the coming weeks, we will take a closer look at the sensor data and provide specific examples of the insights generated. We welcome your feedback, so feel free to respond directly to the email with any questions or suggestions for topics that you would like to see covered.


